
Volatility has eased sharply after the May 19 crash, with bitcoin settling sideways within the trading range of that memorable day with diminishing swings. Since last weekend, it has been moving slightly upwards again.
In mid-May, bitcoin investors, who had recently been spoiled, were rudely dragged out of their castle in the air and brought back down to earth: Cryptocurrencies are extremely volatile underlying assets. The one-way street towards the north already ended in the weeks before, bitcoin only settled sideways. Other cryptos were able to make further gains and mark new highs during this period, but the Bitcoin was out of steam. In mid-May, a selling panic set in, and the price plummeted by around 50% from a standing start.
Stabilization after the shock
After the crash-like collapse on May 19 and an initial steep upward countermovement, the price stabilized. The coin swung into a sideways movement, the trading range narrowed into a triangle. It is still moving in the trading range of this one day.
With the recovery of the last few days, the bulls are now taking courage again, today the triangle will leave intraday to the top. If bitcoin stays strong today, a small buy signal will be active on the lower time levels. A price recovery to 42,000 – 42,500 and possibly 45,700 – 46,200 USD would then be possible.
Intraday chart (1 candle = 4 hours):
Trend reversal or flash in the pan?
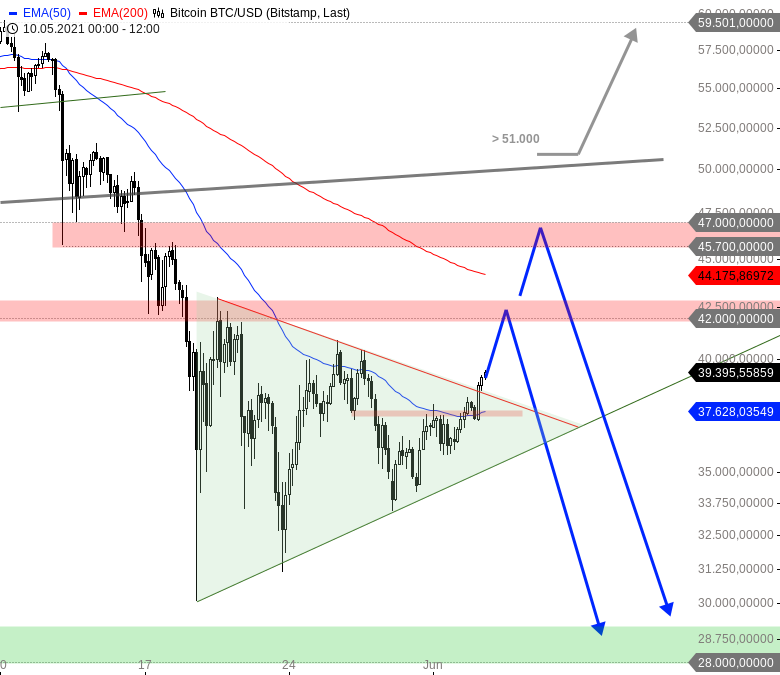
In the intraday chart, it actually looks like a bottoming out. However, if we look at the daily chart, we see the value below important chart elements such as the two moving average lines EMA50 and EMA200 rather on bearish terrain. Here, a rise to 42,000 – 42,500 or 45,700 – 46,200 USD would merely be a bearish retracement and, in case of subsequent losses, the formation of a large, bearish SKS (red).
In a bearish scenario, the completion of the current rally will see further declines to USD 28,000 – 29,000 and below USD 24,200 and the old all-time high from 2017 at USD 19,666, where perfect, counter-cyclical entry opportunities could arise.
Even with a larger recovery to USD 50,000 – 51,000, a bearish scenario would not be completely off the table. Only with a sustainable return above 51,000 USD would the bears be completely thwarted. Then nothing stands in the way of a new upward wave to the all-time high and much further. At this point in time, however, this is only the alternative scenario.
Daily chart (1 candle = 1 day):

DepthTrade Outlook
In the short term, the signs point to recovery. Whether there will be a major upward trend reversal beyond that is still completely open. For this, the moving average lines and other chart elements would have to be sustainably overcome again.
The path of lower resistance after a recovery would be the downward one. I don’t really like to believe in the bearish scenario with prices between 20,000 – 30,000 USD yet, after all, the overriding buy signals are completely intact for Bitcoin and also the other major coins.
It would not surprise me at all if the bears were quickly caught off guard again and the currently rather less likely scenario of a rally start would prevail from an analytical point of view. So there are big question marks behind the blue forecast arrows to the downside.