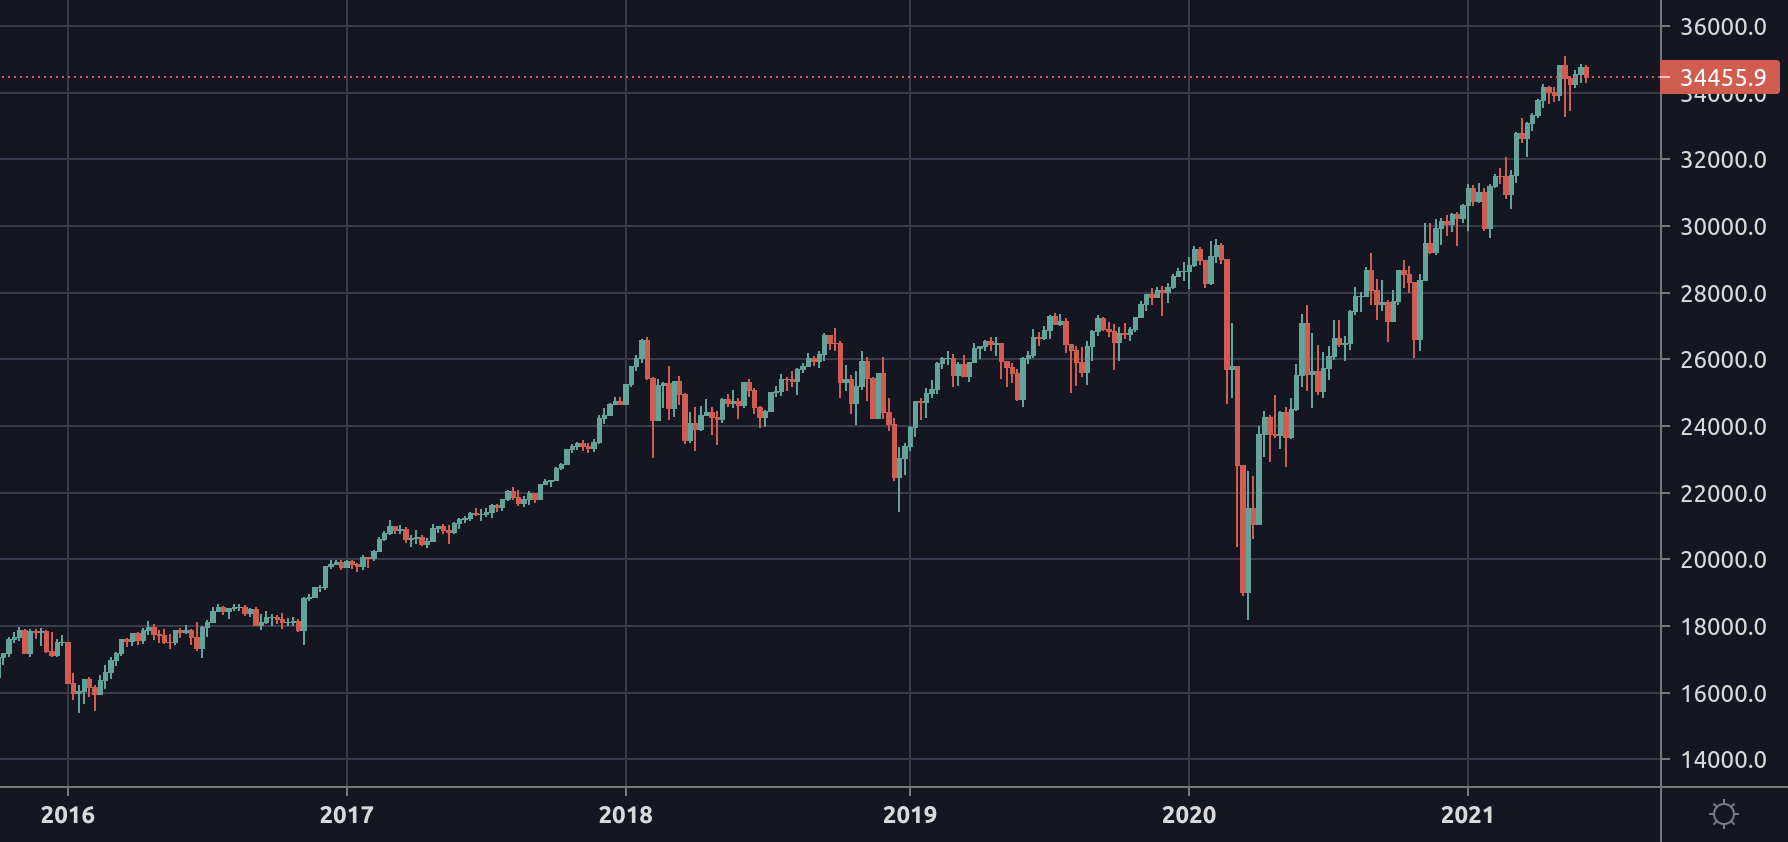
Dow Jones Analysis: Increasing probability of the onset of a correction: Current chart analysis based on technical analysis for the Dow Jones stock index DJ30.
The major uptrend in the Dow Jones stock index (see weekly chart) is intact and is in an extended trend movement phase, which includes an higher probability of the onset of a correction.
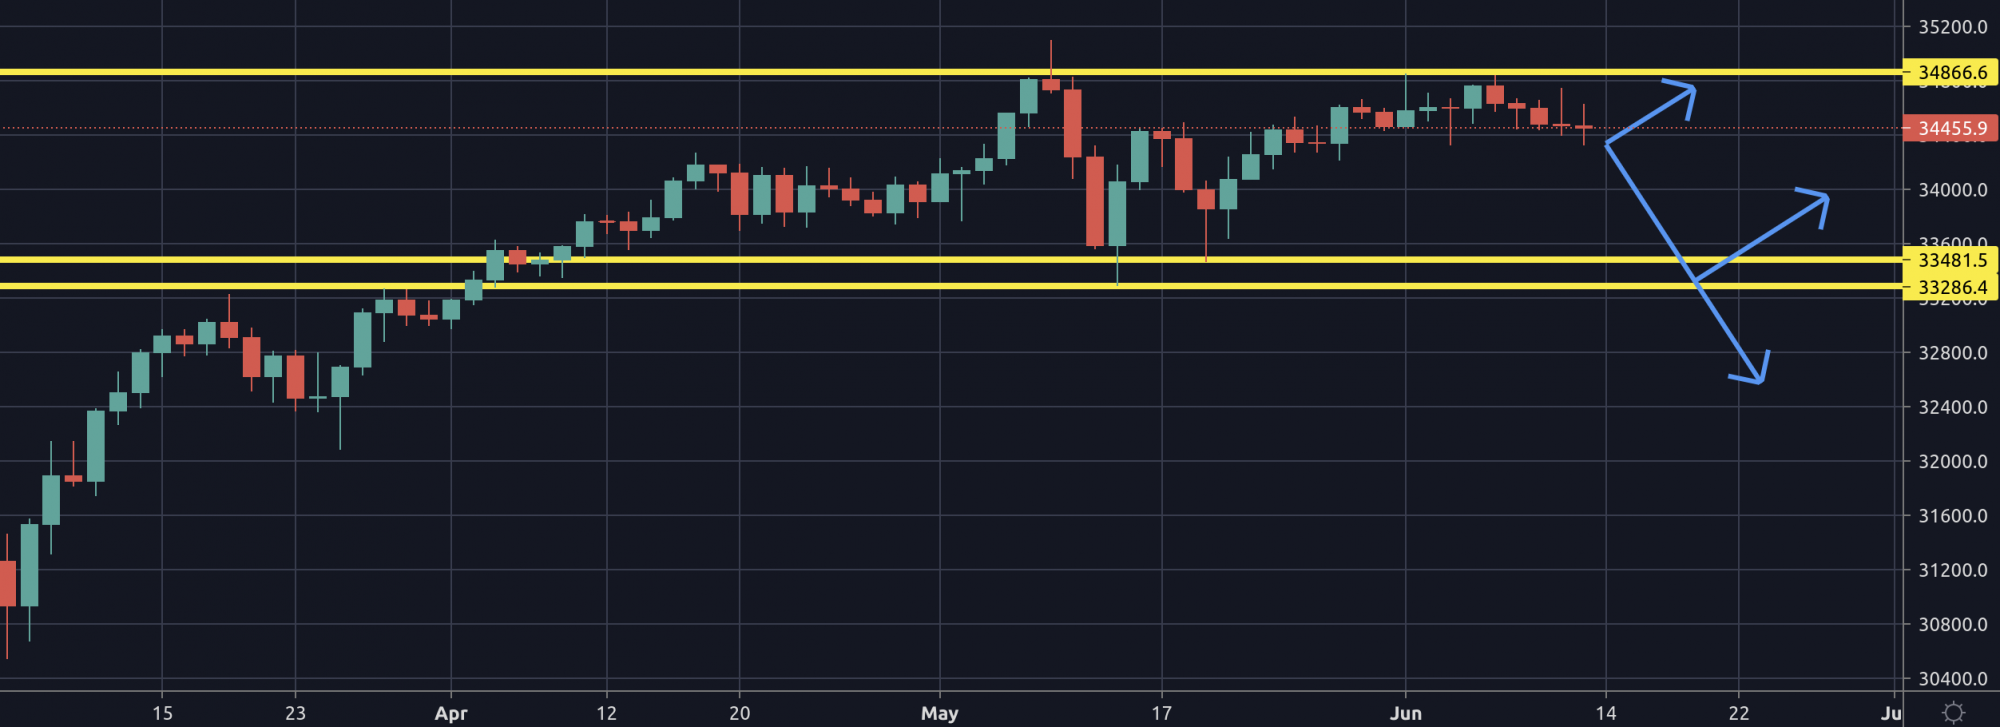
Underlying, an Uptrend (see daily chart below) moves in the direction of the last highest high at 35.100, which increasingly loses its strength and becomes continuously weaker in its price ranges and, moreover, is in a correction.
DepthTrade Outlook
On the basis of the arrow lines you can see exemplary conceivable developments, the market could form in the next few days.
In order to exceed the mentioned high areas, sustained buying is required. If the current correction phase attracts new buyers, this should be underpinned with clearly visible movements.
If strong price rises to the upside fail to materialize, the upward trend is still considered intact as long as the lows at 33.280 and 33.480 are not sustainably penetrated and/or a counter-trend is formed.


